Beverage marketing directed towards children and youth is of growing public health concern. Most of the marketed beverages are high in sugar content, and on average, higher in calories than those marketed to adults.1 In 2013, food and beverage companies spent more than $800 million for marketing sugary beverages (Table 1), and U.S. households consumed $14.3 billion worth of these products.2
Table 1- 2013 Ad spending by food and beverage industries by sugary drink category2
| Sugary Drink Category | 2013 ($millions) | Change vs. 2010 | |
| Regular soda | $384 | +9% | |
| Fruit drinks | $74 | -40% | |
| Energy drinks | $175 | +9% | |
| Sports drinks | $127 | -5% | |
| Iced tea | $32 | -7% | |
| Flavored water | $22 | -43% | |
| Other | $19 | +165% |
Child/youth-directed marketing strategies included promotional activities via print, radio, and company-sponsored websites amongst others.1 However, marketing through television and internet dominated the spending trends in 2013 (Table 2).2
Table 2- 2013 Ad spending by food and beverage industries via TV and Internet2
| Sugary Drink Category | TV | Internet |
| 2013 ($Thousands) | 2013 ($Thousands) | |
| Regular soda | $321,273 | $14,274 |
| Children’s fruit drinks | $29,231 | $946 |
| Other fruit drinks | $22,521 | $40 |
| Energy drinks | $164,116 | $954 |
| Sports drinks | $109,329 | $462 |
| Iced tea | $22,792 | $314 |
| Children’s flavored water | $5,890 | $35 |
| Brand level adds targeting multiple sugary drinks | $15,196 | $24 |
| Total | $690,348 | 17,050 |
These strategies included the use of brand mascots, entertainment companies’ cartoon media characters, athletes, and celebrities. Branding through media characters strongly influences children’s choices in preferring energy-dense products.3
For a while now, public health researchers have pointed out health disparities related to sugary drink consumption. When adjusted for socioeconomic status, African-American and Latino children are more likely to have tooth decay than their white counterparts.4 Recent sugar-sweetened beverage marketing trends parallel these inequalities – African-American children and teenagers are on average two times more likely to be exposed to racially targeted TV advertising (table 3).
Table 3- 2013 TV ad exposure disparities in children and teens2
| Sugary Drink Category | Children (6-11 years) | Teens (12-17 years) | Black: White Targeted Ratios | |||
| All | Black | All | Black | Children | Teen | |
| Regular soda | 43.0 | 72.6 | 85.3 | 143.3 | 2.1 | 2.0 |
| Energy drinks | 40.1 | 79.6 | 97.7 | 180.3 | 2.6 | 2.2 |
| Sports drinks | 17.6 | 29.3 | 34.0 | 57.6 | 2.1 | 1.9 |
| Iced tea | 8.0 | 15.2 | 14.1 | 25.5 | 2.3 | 2.1 |
| Fruit Drinks | 6.1 | 30.0 | 8.2 | 35.7 | 1.8 | 1.9 |
| Flavored water | 3.5 | 44.3 | 9.9 | 43.3 | 1.7 | 2.3 |
(Numbers reflect the average number of ads viewed)
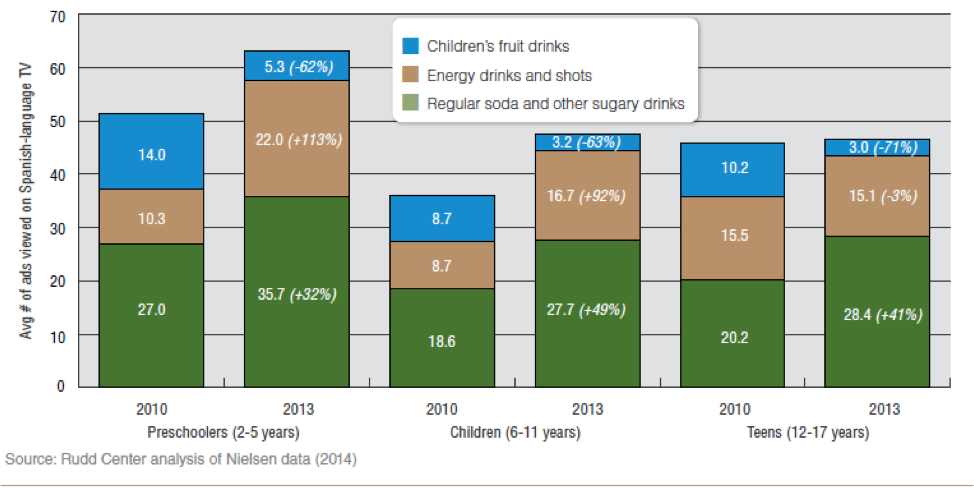
Advertisements on Spanish-language TV for sugary drinks and energy shots also increased in 2013 by 44% versus 2010 (figure 1).2
Figure 1- Ads viewed on Spanish-Language TV by category and age [2]
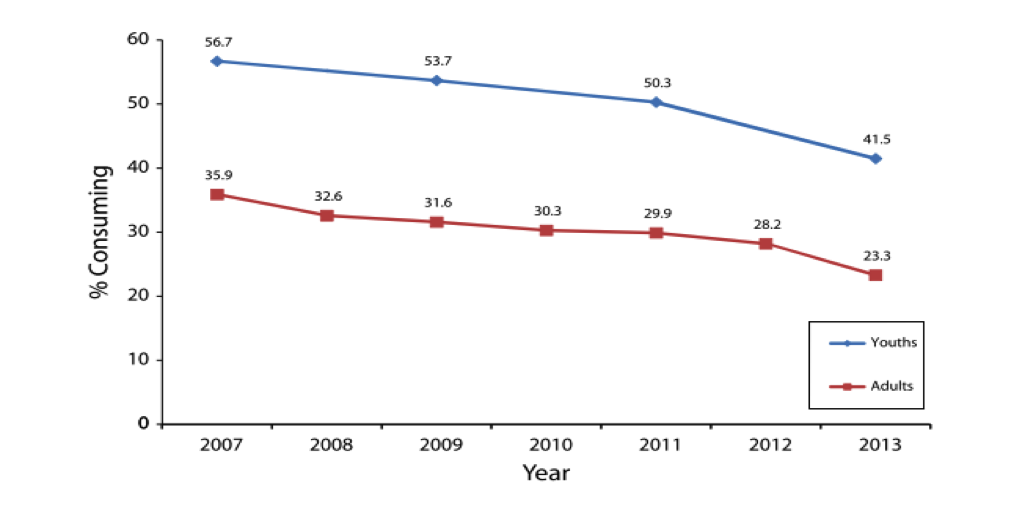
Despite the mounting pressure exerted by sugar-sweetened beverage companies to influence preferences in children and youth nationally, rates of sugary drink consumption in NYC high school students are declining. From 2007 to 2013, students who reported drinking one or more sugary beverages a day reduced by 27%.5 In particular, soda consumption reduced by 33%.5
These NYC trends come from an observational study and parallel the efforts of several institutional changes, educational campaigns, and changes in regulatory policy. To mention some, the efforts included the establishment of nutritional standards for meals purchased and served in city agencies, regulation of nutritional standards in childcare centers and children’s camps, seven mass media campaigns, and calorie posting in restaurant chains.
While the reduction in sugary beverage consumption cannot be attributed to these efforts, they set the groundwork for actionable measures that local governments can take to counter the marketing of sugary beverages towards children and youth.
Figure 2- Youth and Adult sugary drink consumption: New York City, 2007-20135
References
- New York City Department of Healthy and Mental Hygiene. We All Want Healthy Children.
- Harris J, Schwartz M, LoDolce M, et al. Sugary Drink Marketing to Youth : Some Progress but Much Room to Improve.; 2014.
- Kraak VI, Story M. Influence of food companies’ brand mascots and entertainment companies’ cartoon media characters on children’s diet and health: a systematic review and research needs. Obes Rev. 2015;16(February):107-126. doi:10.1111/obr.12237.
- Center for Global Policy Solutions. Policy Options to Reduce Consumption Sugary Drinks in Communities of Color.; 2015.
- Kansagra SM, Kennelly MO, Nonas C a., et al. Reducing Sugary Drink Consumption: New York City’s Approach. Am J Public Health. 2015;105(4):e61-e64. doi:10.2105/AJPH.2014.302497.


