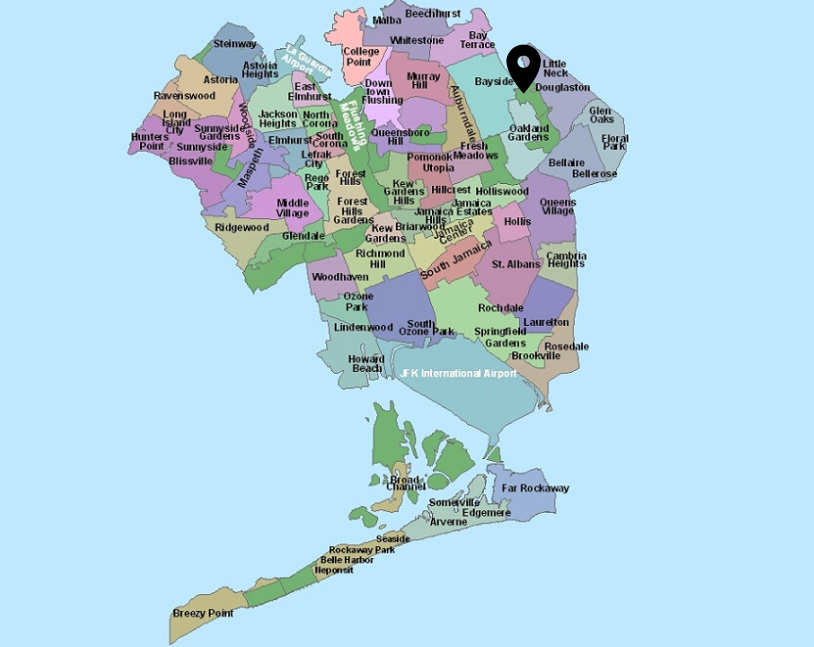
Bayside/Little Neck Foodscape
Queens Community District 11
About Foodscapes
Access to affordable and nutritious food is one of the cornerstones of good health. Without this, individuals—and communities—are at a higher risk of food insecurity and serious chronic diseases, including obesity, diabetes, and heart disease. To improve the health of New Yorkers, we must recognize that each neighborhood has a distinct food environment.
Purpose
These Foodscape reports provide a community-level snapshot of a community’s food environment, including data on healthy and unhealthy food consumption, food access, and diet-related diseases. Additionally, the reports detail a comprehensive guide of the many food-related resources available to residents within their neighborhoods to support them in eating healthier. The Hunter College New York City Food Policy Center has compiled this information from various sources, presenting it in a user-friendly format to help NYC residents and communities better understand their local foodscapes.
The NYC Foodscape Reports were published in 2020 and are continually updated every six months. Data in the Foodscape Reports is collected from multiple primary sources to ensure the most up-to-date statistics for each indicator. Learn more about organizations and resources highlighted in the Foodscape Reports by visiting the Center’s Neighborhood Food Resource Guides as well as the Food Policy and Practice Database. Together, these three resources provide a comprehensive food-related guide to each New York City neighborhood.
Zip codes include: 11360, 11361, 11362, 11363, 11364
TABLE OF CONTENTS:
- DEMOGRAPHICS
- NEIGHBORHOOD ACCESS TO HEALTHY FOOD
- FOOD CONSUMPTION
- HEALTH AND DISEASE STATUS
- ECONOMIC AND LIVING-CONDITION STRESS, CONTRIBUTORS TO FOOD INSECURITY
- EXERCISE AND PHYSICAL ACTIVITY BURDEN
- GREENTHUMB GARDENS
- SCHOOL GARDENS
- OFFICIAL SNAP ENROLLMENT SITES IN NYC – HUMAN RESOURCES ASSOCIATION
- FOOD PANTRIES AND SOUP KITCHENS
- RETAIL FOOD STORES
- PHYSICAL ACTIVITY
- ADDITIONAL RESOURCES
DEMOGRAPHICS:
- Total Population: 122,211 (1.4% of NYC population) (1)
- Population by Race and Ethnicity of Bayside/Little Neck and New York City (2)
- Bayside/Little Neck: 11% Latino | NYC: 29.2% Latino
- Bayside/Little Neck: 1.9% Black | NYC: 21,7% Black
- Bayside/Little Neck: 39.5% White | NYC: 31.8% White
- Bayside/Little Neck: 44% Asian/Pacific Islander | NYC: 14.1% Asian
- Bayside/Little Neck: 1.9% Other | NYC: 2% Other
- Bayside/Little Neck Population by Age: (3)
- 0-17 years: 19%
- 18-24 years: 6%
- 25-44 years: 26%
- 45-64 years: 31%
- 65+ years: 18%
- Life Expectancy:
- Born Outside the US:
NEIGHBORHOOD ACCESS TO HEALTHY FOOD:
- Supermarket to Bodega Ratio: One (1) supermarket in Bayside/Little Neck to 5 bodegas (2)
- Meal Gap (# of meals needed per year for food security): 1,819,042 (2)
- Food Insecurity:
- Residences that Lack a Kitchen:
- Households Receiving SNAP Benefits:
HEALTH BEHAVIORS:
- No Fruits and Vegetables Yesterday:
- One or More 12-ounce Sugary Drinks Per Day (percent of adults):
- No Physical Activity in the Last 30 Days:
- Binge Drinking
- Smokers
HEALTH AND DISEASE STATUS:
- Adults Reporting Their Own Health as “Excellent,” “Very Good” or “Good” (percent of adults):
- Obesity (percent of adults):
- Childhood Obesity (percent of public school children in grades K through 8):
- Diabetes (percent of adults):
- Hypertension (percent of adults):
ECONOMIC AND LIVING-CONDITION STRESS, CONTRIBUTORS TO FOOD INSECURITY:
- Median Household Income:
- Poverty (percent of households with incomes below poverty):
- Unemployment (percent of people ages 16 and older):
- Extreme Housing Burden (Extreme Housing Burden includes households spending more than 50% of income on housing):
- Rent Burden (households that spend 35% or more of their income on rent)
EXERCISE AND PHYSICAL ACTIVITY BURDEN
- Air Pollution (micrograms of fine particulate matter per cubic meter):
- Bicycle Network Coverage (percent of streets with bike lanes):
- Pedestrian Injury Hospitalizations (per 100,000 people):
- Percent of Land Used for Public Parks, Open Space, and Recreation:
- Canopy Coverage (percent of ground covered by tree crown/canopy):
To view information on Bayside/Little Neck Community Gardens, Greenthumb Gardens, School Gardens, Farmers’ Markets, Snap Enrollment Sites, Food Pantries, Retail Food Stores, Parks, and more please visit the link below:
REFERENCES:
-
- “2020 Data for NYC, Boros, CDs, Council Districts, NTAs, & Tracts.” NYC Planning. 2021, https://www1.nyc.gov/site/planning/planning-level/nyc-population/2020-census.page.
- “Data2Go: Bayside, Douglaston & Little Neck.” data2go.Nyc, Measure of America of the Social Science Research Council and Helmsley Charitable Trust, https://data2go.nyc/map/?id=411*36047015900*food_insecure_puma!undefined!ns*!buttonHolder~other_pop_cd_506~ahdi_puma_1~sch_enrol_cd_112~age_pyramid_male_85_plus_cd_20~median_household_income_puma_397~median_personal_earnings_puma_400~dis_y_perc_puma_102~poverty_ceo_cd_417~unemployment_cd_408~pre_k_cd_107!*air_qual_cd~ahdi_puma*family_homeless_cd_245#11/40.7769/-73.9795.
- Hinterland, K, et al. “Community Health Profiles 2018, Queens Community District 11: Bayside and Little Neck.” Community Health Profiles 2018, Queens Community District 11: Bayside and Little Neck, 2018, pp. 1–20.
- “Green Thumb Garden Map.” NYC Parks, https://greenthumb.nycgovparks.org/gardensearch.php.
- “NYC Community District Profiles” NYC Planning https://communityprofiles.planning.nyc.gov/bronx/2#indicators.
- Treglia ML, Acosta-Morel M, Crabtree D, Galbo K, Lin-Moges T, Van Slooten A, Maxwell EN. The State of the Urban Forest in New York City. The Nature Conservancy. 2021. doi:10.5281/zenodo.5532876
Article Image: “New York City (NYC) Neighborhood Maps – By Borough – Queens.” NYCdata, Baruch College Zicklin School of Business, https://www.baruch.cuny.edu/nycdata/population-geography/maps-boroughs.htm.


