 NYC Food by the Numbers: New York’s Food Policy Scorecard
Food Policy Action is an advocacy group that seeks to hold legislators nationwide accountable on votes that impact our food system, on issues ranging from farm labor, nutrition, production and farming, additives, to environmental impact. We thought our readers would be interested to know how their New York State Senators and Representatives voted this year.
 NYC Food by the Numbers: Zoning for Health: Food
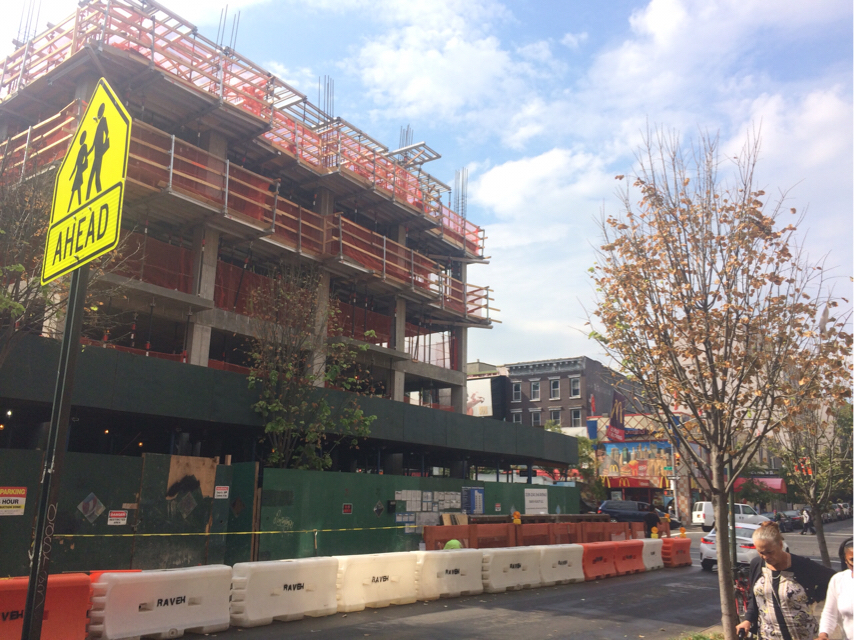
Seven neighborhoods have begun a community rezoning process. Here we compare these communities using data from the NYC Department of Health’s 2015 Community Health Profiles. How can zoning shape our local food environments to improve our health?
 NYC Food by the Numbers: Pathmark, 125th Street
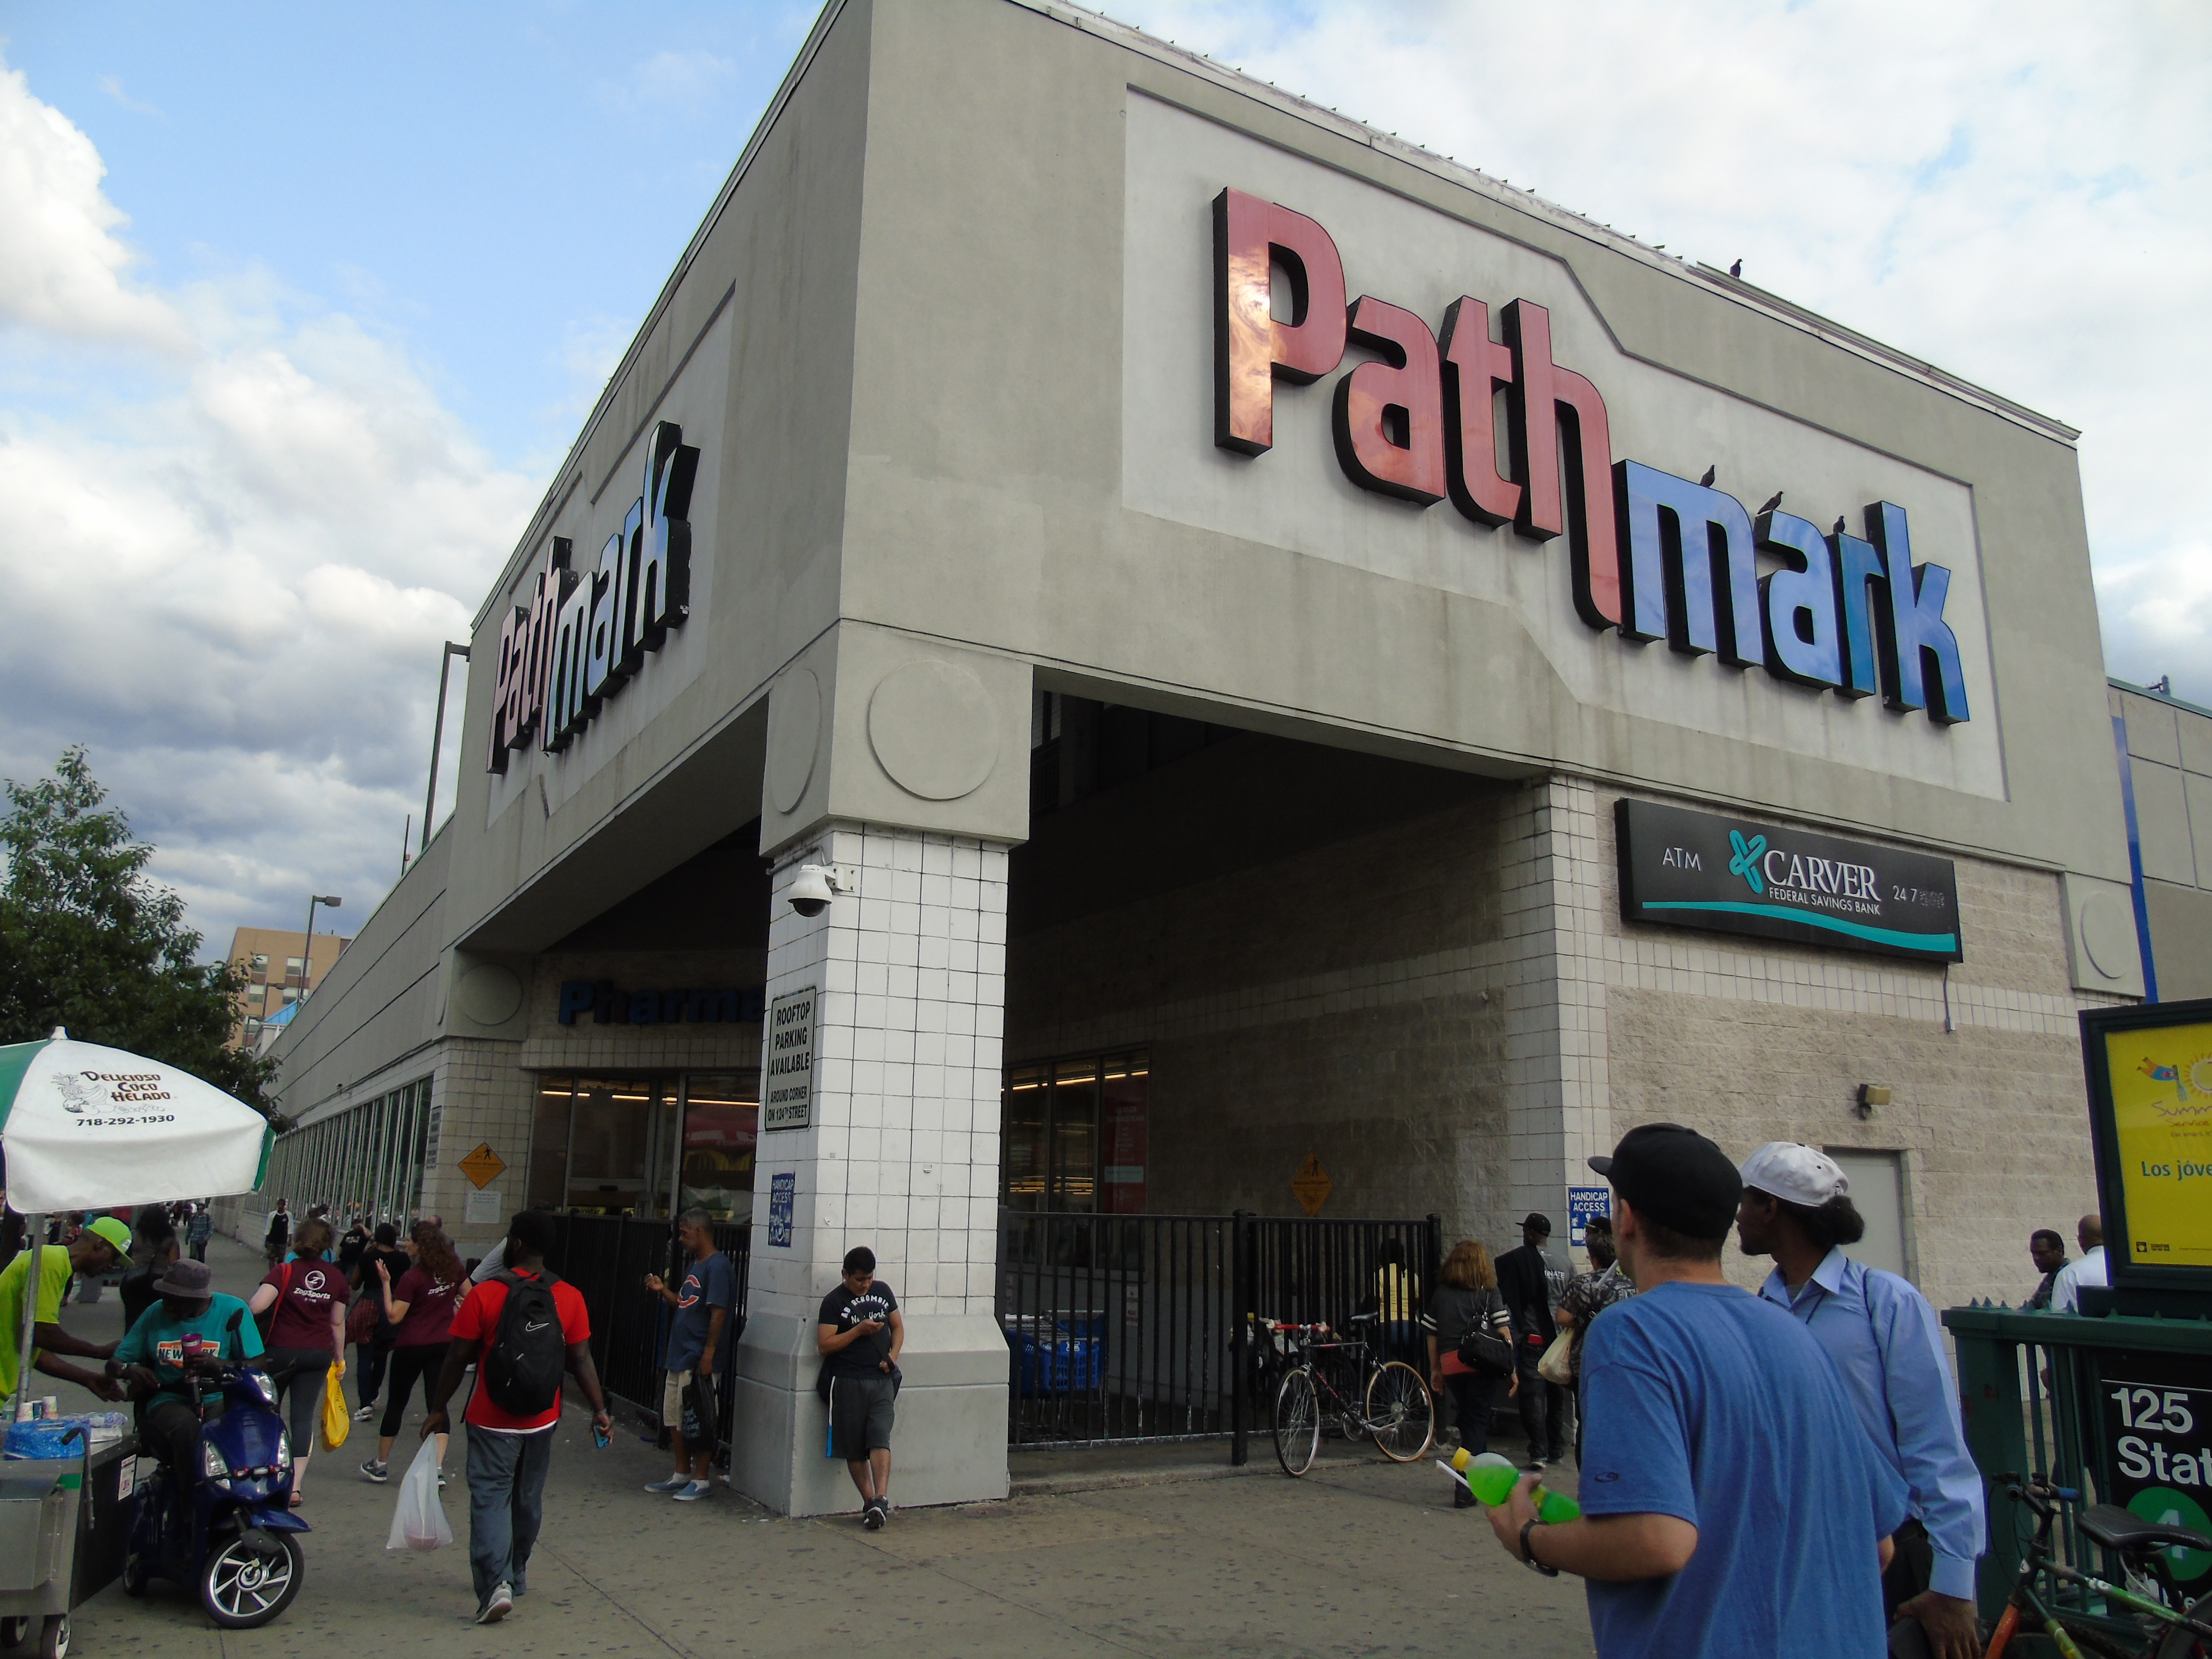
The recent sale of the building that houses Pathmark at 125th street and Lexington Avenue has raised concerns about the future of food access to the residents of East Harlem. Here we highlight some recent numbers from our report, Beyond Pathmark?
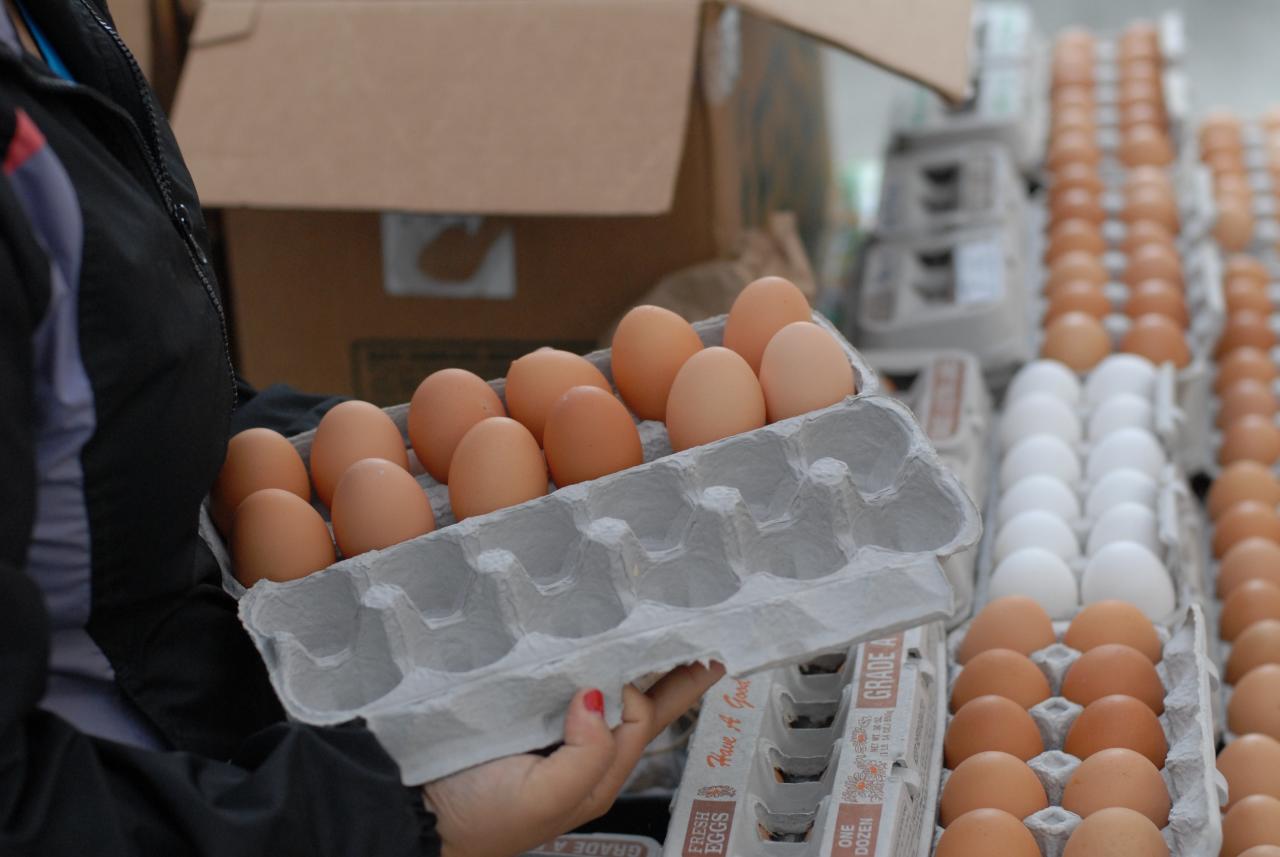
 NYC Food by the Numbers: Apples
New York State produced 1.3 billion pounds of apples in 2014, ranking second in the country after Washington State- and New Yorkers are eating more local apples than they realize.
 NYC Food by the Numbers: Summer Meals
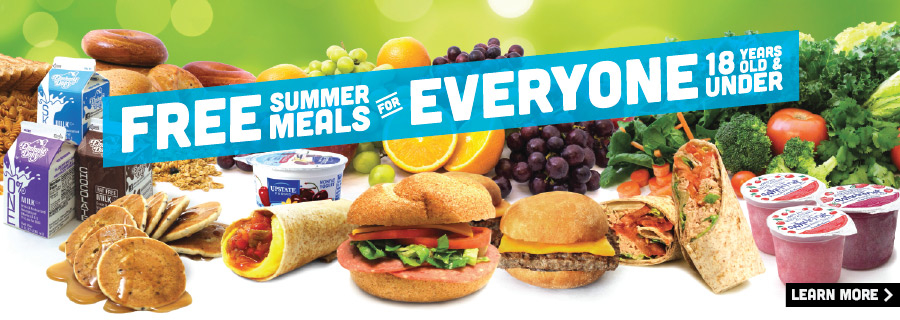
Summer meals are available to all children ages 18 and under, free of charge, at many locations across the city including schools, community pools, NYCHA complexes, libraries, community centers and day camps when school is not in session. With the 2015 season now in full swing, we provide here an overview of summer meals statistics and trends.
 NYC Food by the Numbers: Universal Free Lunch in NYC Middle Schools
Our March 2014 “NYC Food by the Numbers” focused on Lunch 4 Learning, a campaign for universal free school lunched in NYC. Free school lunches were listed as a priority for last year’s city budget by the City Council. However, the program piloted only in stand-alone NYC middle schools. This year, the program has not been included in the City Council’s budget as well, which is due to take effect on July 1, 2015. As the date fast approaches, we present fresh statistics on how the universal school lunches in middle schools have fared so far, and what the implications of <0.03% of the City Council’s budget could look like for food security amongst NYC school children.
 NYC Food by the Numbers: New York State Agriculture
Even before the Department of Housing Prevention and Development released a request for bids to develop affordable housing on land that included 17 community gardens, urban agriculture has been a hotly debated subject in NYC among advocates of the power of community gardens and urban farms, and those who support the development of affordable housing. Here we provide an overview of the urban agricultural landscape of NYC, highlighting numbers from Manhattan Borough President Gale Brewer’s recent report How Our Gardens Grow: Strategies for Expanding Urban Agriculture as well as a other NYC publications including the 2014 Food Metrics Report and OneNYC.
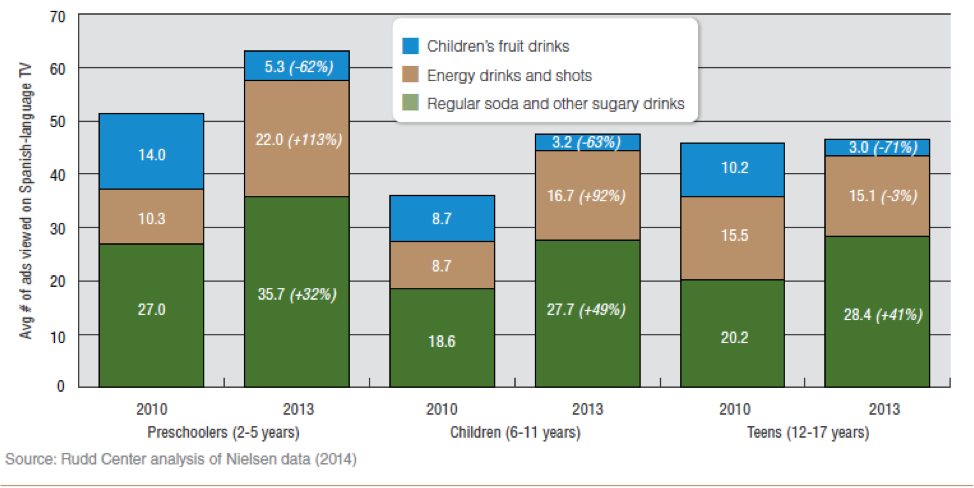
NYC Food by the Numbers: Youth Directed Sugar Sweetened Beverage Marketing
Beverage marketing directed towards children and youth is of growing public health concern. Most of the marketed beverages are high in sugar content, and on average, higher in calories than those marketed to adults.1 In 2013, food and beverage companies spent more than $800 million for marketing sugary beverages (table 1), and U.S. households consumed $14.3 billion worth these products. Despite the mounting pressure of sugar-sweetened beverages to influence preferences in children and youth nationally, rates of sugary drink consumption in NYC high school students are declining.
NYC Food by the Numbers: New York State Agriculture
Agriculture is a critical component of New York State’s economy. The food grown in the state provides many benefits to residents of New York City including employment, tax revenue, access to fresh and local food, open space preservation, farmers markets and tourism. A recent publication from NYS Comptroller Thomas P. DiNapoli, The Importance of Agriculture to the New York State Economy, summarizes statewide data from the 2012 USDA Census of Agriculture. Here we highlight some key numbers related to food jobs, economic growth and impact, agricultural commodities and urban agriculture.
 NYC Food by the Numbers: Fast Food
The fast food industry represents a significant segment of New York City’s food workforce. Here we provide some local and national statistics on fast food establishments and their workers. Can you guess the largest fast food chain in NYC? Hint: it’s not McDonalds!
NYC Food by the Numbers: Food Waste
In 2013, former Mayor Bloomberg committed to diverting 75% of New York City’s waste from landfill by 2030. City efforts to reduce food waste take many forms, including:
• Mayor’s Food Waste Challenge: With a goal of reducing landfilled food waste by 50%, Mayor Bloomberg invited New York City Restaurants to participate in the Mayor’s Food Waste Challenge. Learn more about the structure and benefits of the Food Waste Challenge.
• NYC Healthy Food Donation Initiative
 NYC Food by the Numbers: Changes in poverty, food insecurity, and SNAP Participation in NYC
New Yorkers’ participation in the federal Supplemental Nutrition Assistance Program (SNAP), formerly known as Food Stamps, increased 71.1% between June, 2006, before the recession, and June, 2013. This long term upward trend has finally reversed. Across-the-board benefit cuts that took effect in November, 2013 reduced the average grant per household, and increases in employment made some previous participants ineligible. We provide some figures to help clarify.

NYC Food by the Numbers: Food Trucks
In many cities, food trucks have become an important part of the food scene. What’s the story in New York City?
Number of licenses NYC Department of Health issues for food trucks and carts: 5,100 mobile-food-vending permits, which include trucks and food carts; just 500 belong to food-truck operators.
Most common food sold by food trucks: ice cream
 NYC Food by the Numbers: Climate Change and our Food Supply
Some numbers illustrate the breadth and magnitude of our complex food system here in New York City and beyond.
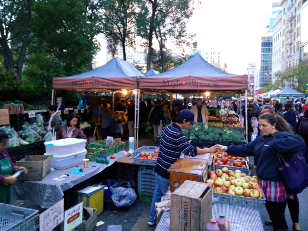 NYC Food by the Numbers: Farmers’ Markets
It’s farmers’ market season across New York City and State. Here are some numbers that illustrate the impact that these markets have on residents, farmers, communities and the local economy. Read more…
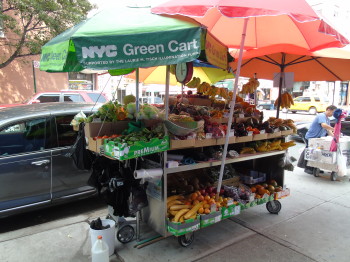 NYC Food by the Numbers: Green Carts
Columbia University’s School of International and Public Affairs (SIPA) released a report based on a study conducted to analyze the NYC Green Cart Initiative, its effects on fresh fruit and vegetable access for low-income New Yorkers, the sustainability of Green Carts as independent businesses and as a case study for how philanthropy can play a role in the support and promotion of innovative public policy. We highlight below some key findings, by the numbers.
Read more…
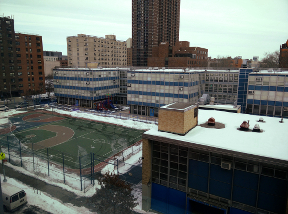 NYC Food by the Numbers: East Harlem
In order to create healthier local food environments, public officials, advocates and community residents need detailed information on current conditions. To help develop that understanding, we summarize data on food environments in East Harlem.
Read more…
NYC Food by The Numbers: The Hunts Point Food Distribution Center
Year of opening: 1967
Previous site: Washington Market in lower Manhattan from 1812-1967
Owner of site: New York City Economic Development Corporation
Annual revenues: about $2.5 billion
Acres of land: 113
Total number of employees: 7,000 -10,000 (includes sellers, buyers and distributors)
Number of people who depend on market for produce: 23 million; market supplies NYC residents with 60% of daily fruits and vegetables
Components: Hunts Point Produce Market, Hunts Point Meat Market and New Fulton Fish Market
Major food processor: Bazzini Nuts which coats nuts with chocolate
Size of Produce Market: 1 million square feet divided into 270 store units
Number of purveyors: 39 in Meat Market, 42 in Produce Market and 34 in New Fulton Fish Market
Number of truck deliveries: 130,000 per year

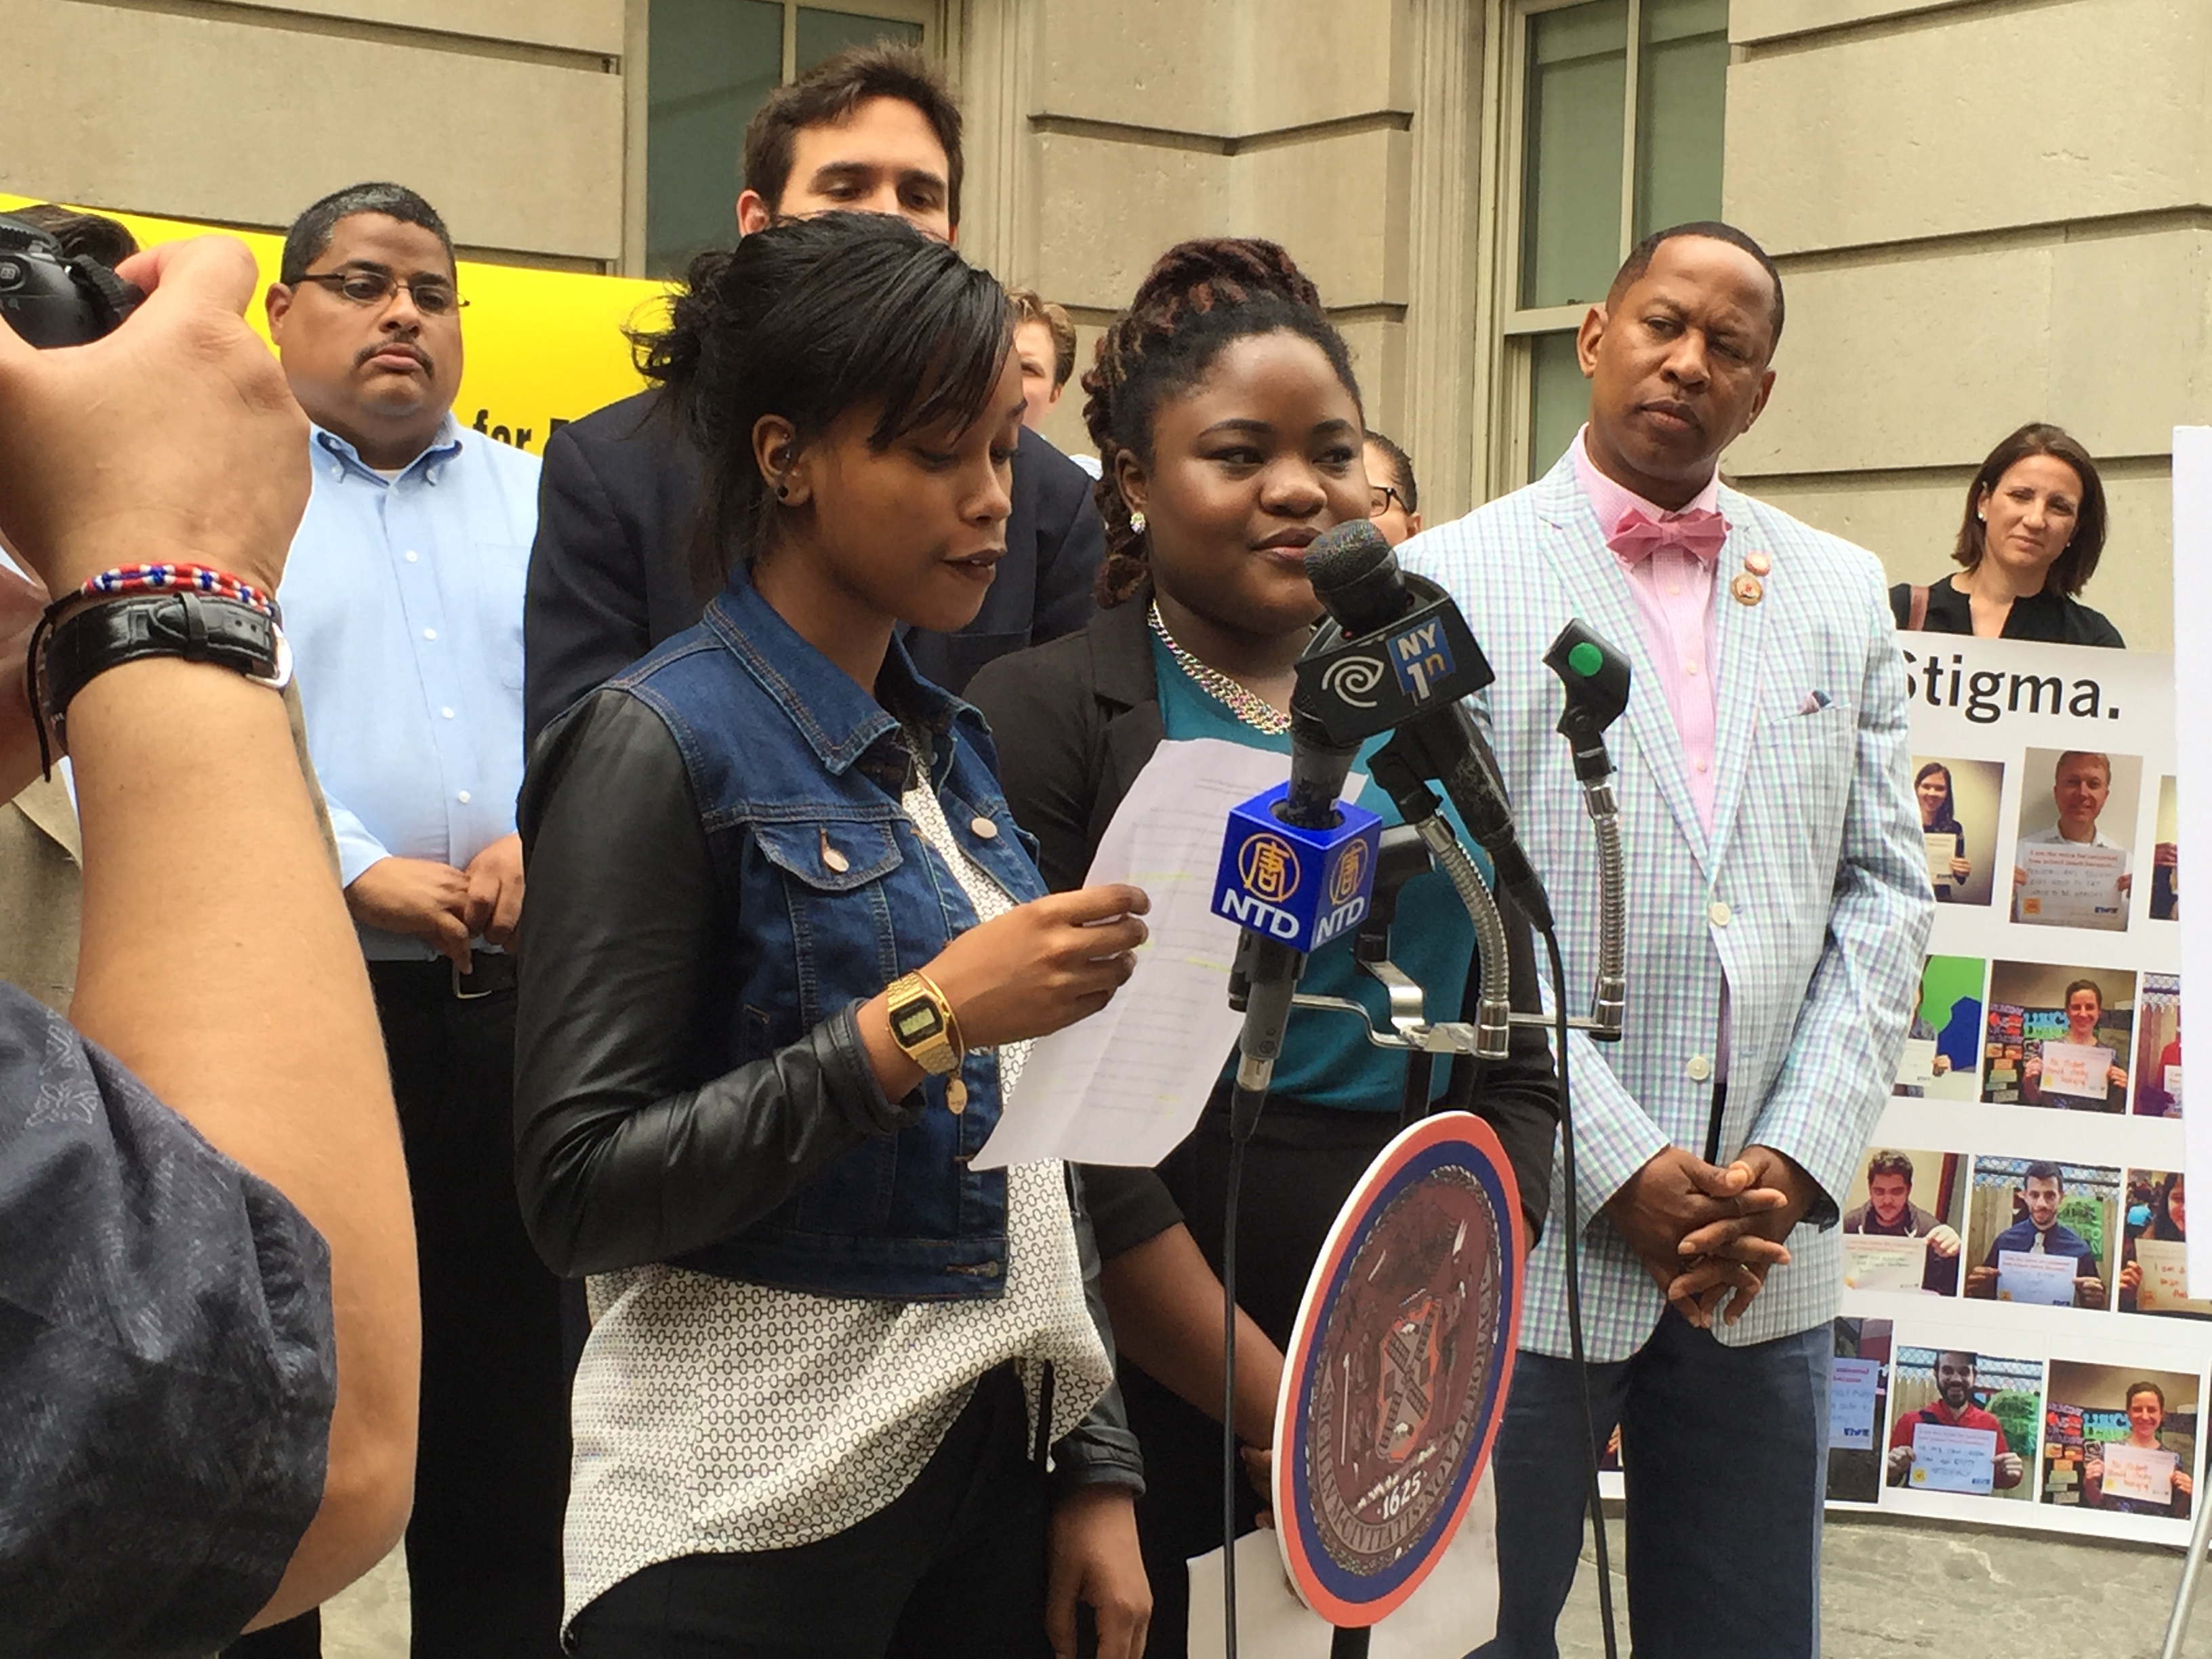
New York City Food by the Numbers: Lunch 4 Learning
Lunch 4 Learning is a campaign for universal free school lunches in New York City, initiated and led by Community Food Advocates. On March 11, 2014 Public Advocate Letitia James held a Press Conference at City Hall with Lunch 4 Learning staff and supporters, in which she announced her support for universal free school meals. Public Advocate James urged Mayor DeBlasio to implement universal free meals immediately to remove the distinction between paying and free and reduced price customers, and thus the stigma that deters many youngsters from participating, especially as they reach the socially sensitive middle and high school years. She pointed out that most NYC public school students who do not qualify for Free or Reduced Price meals are not rich; their families, too, are struggling to make ends meet. Rochester, Buffalo, Syracuse, Poughkeepsie, and Hempstead have all used a new federal option to provide free meals to all their students.
NYC Food by the Numbers: Lunch 4 Learning
Participation in the school lunch program is low—but not for a lack of need. —> 75% of NYC students are eligible for free or reduced price school lunches, which means that their annual family income is less than $36,000 for family of three, but only 530,000 of these actually participate. Changing the current system – which links school food with family income – gets rid of the income stigma, that greatly impacts participation, especially as children get older. —>
Students eating school lunch: 81% in elementary, 61% in middle school, and 38% in high school. 250,000 of the students who are eligible for free meals do not participate. Universal School Meals Works —>
NYC schools that provide free school lunch to all students through a federal incentive program called “Provision 2” had significant increases in the number of students eating, especially in middle and high schools. This proves true in other places that have universal free school lunch. Over time, at least an additional 120,000 children will eat school lunch each day. A 20% increase in participation would bring in an additional $59 million in federal and state funds and require an additional investment of $20 million in NYC funds, or $20/student per year. —> This $20 million represents .0025% of the City’s current $8 billion investment in the NYC Department of Education budget. Universal free school lunch is WIN-WIN-WIN! It benefits students and families, schools, and the local economy. —>
For every 10% increase in participation, the equivalent of 500 SchoolFood© jobs are created and local economic activity is increased. Data provided by Lunch 4 Learning: Key Points
NYC Food by the Numbers: The City’s Public Plate -Part 1- Schools
Each year, New York City governments provides more than 270 million meals and snacks in city agencies such as schools, hospitals, child care centers, senior centers and jails. Schools account for 66% of these meals and snacks. What some have called New York City’s “public plate” is a vital but understudied part of New York City’s food system. In a forthcoming report, the New York City Food Policy Center will profile this public plate and suggest strategies for strengthening its ability to improve the nutrition of New York City’s most vulnerable populations.
Here are some numbers about the school food program:
- Approximately 2000 public, charter, and private schools are served by the NYC Department of Education’s Office of SchoolFood and Nutrition Services
- 1240 of New York City’s 1700 public schools have their own kitchens from which they provide school meals
- In 2011, the NYC Independent Budget Office calculated that federal government contributed about $405 million, New York State about $18 million and New York City about $73 million to the city’s school food program
- Increasing enrollment in the city’s school lunch program by 15% would generate 883 new jobs in school food
- The Office of SchoolFood offers 26 menus from which schools can choose lunches
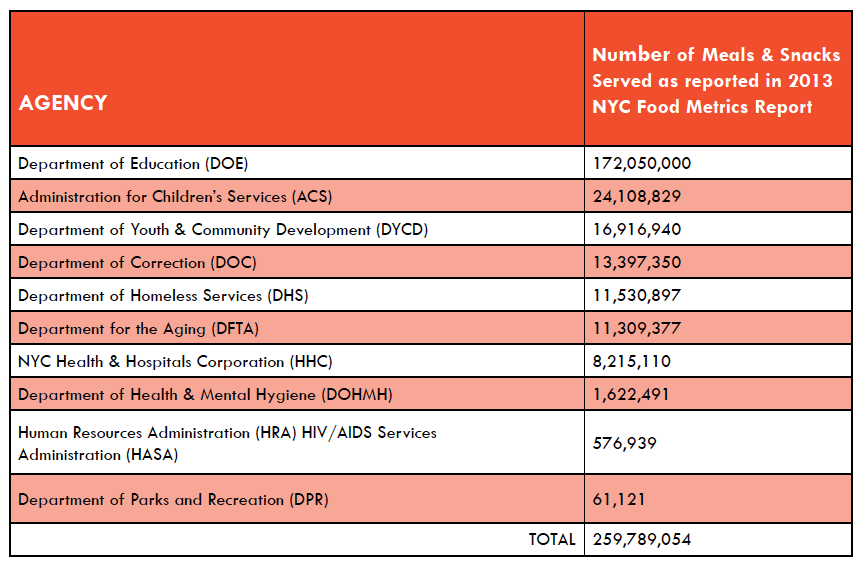
NYC Food by the Numbers: Meals Served in NYC Agencies
Ten NYC agencies provide meals to New Yorkers. They are listed below in order of the number of meals and snacks served annually, from the largest to the smallest, based on the 2013 Food Metrics Report.
NYC Food by the Numbers: Diabetes in New York City
Like so many other parts of the world, New York City is in the midst of an epidemic of diet-related diseases.
Among the conditions that have been related to diet are heart diseases, hypertension, stroke and cancer. But no health condition is more dependent on diet that Type II diabetes. CDC director Tom Frieden, the former Commissioner of Health in New York City once observed that diabetes follows obesity as night follows day. Below are some of the numbers about diabetes in New York City. read more…
NYC Food by the Numbers: Hunger, Food Insecurity and SNAP Enrollment
One of the most striking failures of the city’s food system is the persistence of hunger and food insecurity in the wealthiest city in the world. Here are some numbers:
– More than 1.3 million New York City residents, including one in five children and one in ten seniors(over the age of 60), live in households that lack sufficient food.
– In the last five years, the number of city residents experiencing food insecurity has increased by more than 200,000. In New York State, the number of people experiencing food insecurity has increased by 40% since 2000-2002.
– In 2013, New York City’s food pantries and soup kitchens reported a 10% increase in demand; 63% reported food shortages this year. read more…
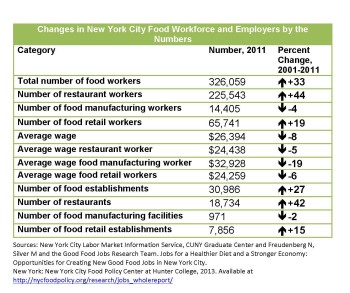
Changes in NYC Food Workforce and Employers by the Numbers